Reader brief
What this note will resolve
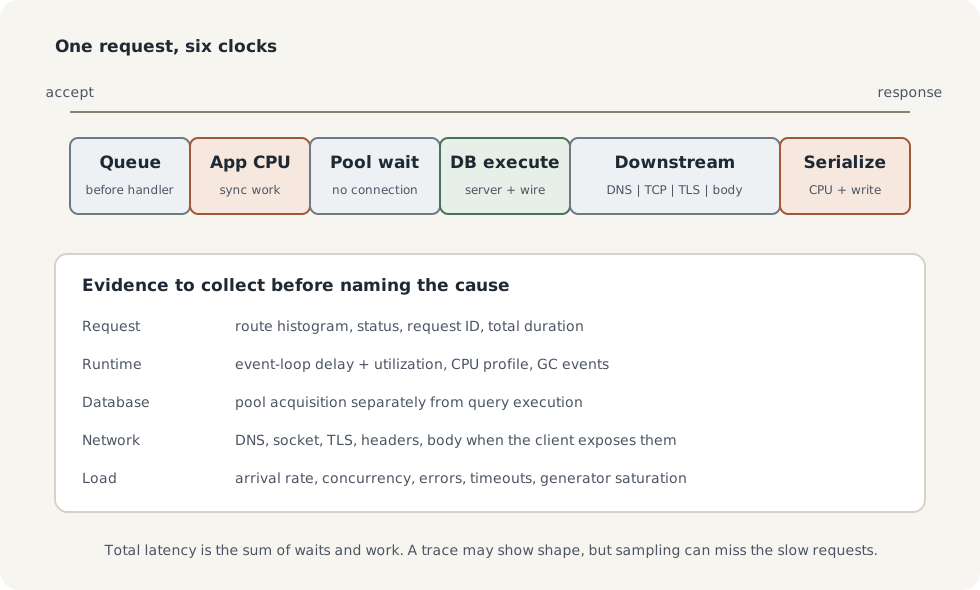
Decompose request latency into queueing, application, database, and downstream clocks
Use event-loop delay and utilization together before profiling synchronous work
Separate database pool acquisition from query execution in logs, metrics, and traces
Run a load test that records distributions, errors, warm-up, and arrival assumptions
Useful if
- Node.js engineers investigating APIs whose averages look healthy while users report stalls
- Technical leads deciding whether a latency incident belongs to application, database, or dependency owners
Concepts in scope
- Tail latency
- Queueing delay
- Event-loop delay
- Event-loop utilization
- Pool wait
- Distributed tracing
- CPU profiling
- Coordinated omission
On this page13 sections
- Read latency as a distribution
- Give the request a latency budget
- Correlate every stage with one request ID
- Separate pool wait from database time
- Measure downstream stages when the client exposes them
- Event-loop delay and utilization answer different questions
- The reproducible slow-endpoint experiment
- Avoid coordinated omission in load tests
- Use traces for shape, not as complete truth
- Escalate to CPU, GC, and heap evidence
- Diagnostic decision tree
- Symptom-to-next-test table
- Production operating checklist
An API can average 40 ms while one request in twenty takes 900 ms. The average does not identify those slow requests, and an event-loop graph does not prove that Node.js caused them. Pool exhaustion, a slow query, DNS, TLS, a downstream queue, garbage collection, or synchronous JavaScript can produce similar top-line latency.
Start with one rule: measure the whole request and each wait separately before naming the bottleneck. Correlate p95 with event-loop delay, event-loop utilization, pool acquisition, database execution, downstream phases, CPU, and errors over the same time window.
This note gives a diagnostic sequence, a tested slow endpoint, and the limits of each signal. Afterward, you should be able to choose the next discriminating test instead of treating every spike as an event-loop incident.
Read latency as a distribution
Latency is elapsed time from a defined start to a defined end. State both. An edge proxy may measure from first request byte to last response byte. Application middleware may start after a socket has already waited and end when headers are written. Those values describe different boundaries.
Percentiles summarize the distribution:
- p50 is the median. Half of observations are at or below it.
- p95 is the value at or below which about 95 percent fall.
- p99 exposes a thinner tail and needs more observations to estimate well.
- Throughput is completed work per time unit.
- Error rate includes failed responses and timeouts, including client-side deadlines that the server may never record as a response.
Never report a percentile without its window, population, and units. A route’s p95 across one minute is not the same population as the whole service across a day. Separate routes and status classes before aggregation hides their shapes.
Queueing starts when demand exceeds an available resource. Requests can wait for an event-loop turn, a database connection, a worker, a socket, a rate limiter, or a downstream response. The queue can dominate total latency even when the work performed for one request is fast.
Give the request a latency budget
A budget turns “slow” into a falsifiable allocation. For a 300 ms p95 objective, one example is:
| Stage | p95 budget | Measurement boundary |
|---|---|---|
| Edge and admission | 25 ms | Edge receive to application handler start |
| Application CPU and scheduling | 35 ms | Handler work excluding named I/O awaits |
| Database pool wait | 20 ms | Acquire requested to connection granted |
| Database execution | 90 ms | Query send to result received |
| Downstream HTTP | 80 ms | Attempt start to required response body read |
| Serialization and response | 20 ms | Result ready to response completion callback |
| Unallocated margin | 30 ms | Variance, instrumentation gaps, and overlap |
The stages are not always strictly additive because work can overlap. The table is a diagnostic contract, not a universal target. It forces each owner to define where its clock begins and ends.
Correlate every stage with one request ID
Use a low-cardinality route name for metrics and a request ID for logs and traces.
Node.js 24 marks AsyncLocalStorage stable and recommends it over building a
custom async context mechanism.
import { AsyncLocalStorage } from "node:async_hooks";
import { randomUUID } from "node:crypto";
import { performance } from "node:perf_hooks";

type RequestContext = { requestId: string; route: string };
const context = new AsyncLocalStorage<RequestContext>();

export function withRequest<T>(route: string, work: () => Promise<T>) {
  const store = { requestId: randomUUID(), route };
  return context.run(store, async () => {
    const started = performance.now();
    try {
      return await work();
    } finally {
      log.info({ ...store, requestMs: performance.now() - started });
    }
  });
}

export async function timed<T>(stage: string, work: () => Promise<T>) {
  const started = performance.now();
  try {
    return await work();
  } finally {
    log.info({ ...context.getStore(), stage, ms: performance.now() - started });
  }
}
Do not put raw user IDs, full URLs, or SQL text into metric labels. Their cardinality grows without a bound. Logs and sampled traces can hold controlled detail; metrics should use route templates, operation names, status classes, and known dependency names.
Separate pool wait from database time
“The database took 400 ms” is ambiguous. The query may have executed in 20 ms after waiting 380 ms for a connection.
Instrument both boundaries:
const acquireStarted = performance.now();
const client = await pool.connect();
const poolWaitMs = performance.now() - acquireStarted;

try {
  const queryStarted = performance.now();
  const result = await client.query({
    name: "tenant-orders-page-v3",
    text: `SELECT id, status, created_at
           FROM orders
           WHERE tenant_id = $1 AND created_at < $2
           ORDER BY created_at DESC
           LIMIT 50`,
    values: [tenantId, cursor],
  });
  const dbMs = performance.now() - queryStarted;
  log.info({ ...context.getStore(), poolWaitMs, dbMs, rows: result.rowCount });
  return result.rows;
} finally {
  client.release();
}
High pool wait with normal query time points toward concurrency, transactions holding connections, pool sizing, or database connection capacity. High query time with low pool wait points toward plans, locks, I/O, row counts, or server load. Check PostgreSQL’s own statement and lock evidence before changing Node’s pool size. A larger pool can move the queue into the database and increase contention.
The PostgreSQL migration lock analysis shows why database lock wait and statement execution also need separate limits.
Measure downstream stages when the client exposes them
An outbound request can spend time in DNS lookup, socket acquisition, TCP connect, TLS negotiation, request upload, time to response headers, and response body reading. Connection reuse can make DNS, TCP, and TLS absent from most requests, so compare reused and new connections before attributing a spike.
Instrument the narrowest boundaries your HTTP client supports. At minimum record pool or dispatcher wait, attempt number, response-header time, body completion, status, timeout phase, and remote service name. Never label all failures as one “HTTP timeout.”
OpenTelemetry’s HTTP semantic conventions define useful common attributes, but the specification states that a client span may or may not include connection time and may or may not include reading the response body. Read the actual instrumentation’s boundary. A span named after a remote service is not evidence that every millisecond happened on the remote server.
Event-loop delay and utilization answer different questions
Event-loop delay measures how late the loop handles scheduled work. Node’s
monitorEventLoopDelay() returns a histogram in nanoseconds. Convert it before
publishing milliseconds:
import { monitorEventLoopDelay, performance } from "node:perf_hooks";

const loopDelay = monitorEventLoopDelay({ resolution: 10 });
loopDelay.enable();
let previous = performance.eventLoopUtilization();

setInterval(() => {
  const elu = performance.eventLoopUtilization(previous);
  previous = performance.eventLoopUtilization();

  metrics.observe("node_event_loop_delay_p95_ms", loopDelay.percentile(95) / 1e6);
  metrics.set("node_event_loop_utilization_ratio", elu.utilization);
  loopDelay.reset();
}, 10_000).unref();
The code is a mechanism example. In production, align collection with the metrics library and process lifecycle, and test reset semantics.
Event-loop utilization, or ELU, is the fraction of measured event-loop time that was active. High delay with high ELU suggests the loop is continuously busy. High delay with only moderate average ELU can indicate bursts, long synchronous tasks, CPU scheduling pressure, or coarse collection windows. Low loop delay does not clear the database or a remote service.
CPU-bound JavaScript, synchronous crypto, compression, large JSON work, regular expressions with pathological inputs, and native callbacks can delay unrelated requests. Garbage collection can also pause progress. Correlate GC duration and heap behavior before labeling a gap as GC.
The reproducible slow-endpoint experiment
The repository’s research/node-latency-lab runs the server in one Node process
and the load driver in another. The /io route awaits a 5 ms timer. The /cpu
route occupies the event loop for 12 ms per request. Each scenario uses 20
closed-loop workers and 400 requests. A 400-request I/O warm-up runs first, then
five measured runs per scenario.
The environment was the Ubuntu 24.04 project container on Node.js 24.19.0. The
server used the built-in HTTP module. monitorEventLoopDelay used 10 ms
resolution. Client and server shared one host. No database, TLS, proxy, or
network delay was present.
cd research/node-latency-lab
npm test
| Scenario, five runs | Request p50 | Request p95 | Request p99 | Throughput | Loop-delay p95 | ELU |
|---|---|---|---|---|---|---|
| 5 ms async timer | 7.45 to 9.29 ms | 15.95 to 27.29 ms | 21.86 to 34.71 ms | 1,565 to 2,154 req/s | 10.65 to 11.89 ms | 0.197 to 0.341 |
| 12 ms synchronous CPU | 218.89 to 219.15 ms | 449.65 to 450.07 ms | 451.34 to 453.87 ms | 82.08 to 82.14 req/s | 232.13 to 234.75 ms | 0.9986 to 0.9999 |
The CPU route did not merely add 12 ms to each response. At concurrency 20, requests waited while earlier synchronous work occupied the one event loop. The queue amplified a per-request task into roughly 450 ms p95 latency. The near-one ELU and high loop delay support that mechanism in this controlled case.
These are diagnostic results, not capacity numbers. The closed-loop driver waits for a response before each worker sends another request. A fixed-rate external arrival stream can build a larger queue. The experiment does not cover V8 tiering under long runs, production CPU limits, multiple processes, GC pressure, or I/O.
Avoid coordinated omission in load tests
Coordinated omission occurs when a load generator slows its request creation because the system under test is slow. The missing requests are precisely those that would have waited in a real independent arrival stream, so the measured tail can look better than the user experience.
For capacity tests, choose an arrival model that matches traffic. Record the offered rate as well as the achieved throughput. Use a fixed-rate mode with a tool that accounts for coordinated omission, and put generators on separate capacity when they can contend with the server. Autocannon documents corrected latency when rate limiting is configured, and also warns that its own JavaScript process can saturate CPU.
Warm the application, connections, query plans, and caches in a documented way. Run long enough to observe GC and periodic work. Keep errors and timeouts in the result rather than dropping them from latency statistics. A fast error response is not a successful capacity result.
Use traces for shape, not as complete truth
One server span should lead to child spans or timed events for pool acquisition, database work, downstream attempts, and meaningful application stages. Propagate trace context across queues and services. Record retry attempts separately so one logical request does not hide several network calls.
Tracing has limits:
- Head sampling can discard a request before knowing it will be slow.
- Tail sampling needs buffering and a rule that preserves errors and high latency.
- Instrumentation can end spans before response bodies finish.
- Missing context creates disconnected spans.
- Trace export backpressure can itself consume resources.
- A span duration gives correlation, not a database execution plan or CPU stack.
Use metrics to detect the population-level change, traces to select examples, logs to inspect exact decisions, and profiles to attribute runtime cost.
Escalate to CPU, GC, and heap evidence
If event-loop delay and ELU rise with CPU, capture a CPU profile during the
problem window. Node supports --cpu-prof; Linux perf or tools such as 0x
can produce flame graphs. A flame graph shows where sampled CPU time accumulates.
It does not show time waiting for the database.
If pauses correlate with heap growth or GC, collect heap-used, heap limit, GC kind and duration, allocation rate, and process RSS. Compare allocation profiles or carefully timed heap snapshots. Node warns that taking a heap snapshot stops other main-thread work, can take more than a minute, and can double heap use. Capture one only on a process that may safely crash or be removed from traffic.
Memory growth and latency can relate in several ways: more live objects increase marking work, allocation churn triggers collection more often, and native or buffer memory can raise RSS without appearing as JavaScript heap. Do not infer a heap leak from RSS alone.
Diagnostic decision tree
- Confirm the symptom. Slice request duration by route, status, tenant class, payload band, instance, and deployment version. Check throughput and errors.
- Locate the wait. Compare handler time with edge time. Break handler time into pool wait, query, downstream, and application stages.
- If pool wait rises: inspect checked-out connections, transaction age, pool acquisition timeouts, and database connection saturation.
- If query time rises: inspect database locks, plans, row estimates, I/O, and server load using the same query fingerprint and time window.
- If downstream time rises: split DNS, connection, TLS, headers, body, retry, and local dispatcher wait where possible.
- If unexplained application time rises: compare event-loop delay, ELU, process CPU, GC pauses, and container throttling.
- If loop delay and CPU are high: capture a CPU profile from a representative instance and reproduce the route with realistic inputs.
- If heap and GC grow: compare allocation profiles or safe heap snapshots.
- Repeat under a controlled arrival model. Preserve errors, document warm-up, and check that the generator did not saturate.
At each branch, ask what observation would disprove the current hypothesis.
Symptom-to-next-test table
| Symptom | Evidence that supports it | Likely cause class | Next test |
|---|---|---|---|
| p95 rises, pool wait rises, query time stable | Pool acquisition histogram and checked-out count | Pool saturation or long connection holds | Find longest checkout and transaction age |
| Query time rises, pool wait stable | Database duration plus matching server statement data | Lock, plan, I/O, or row-count change | Inspect blockers and EXPLAIN (ANALYZE, BUFFERS) safely |
| Loop delay and ELU rise together | Same-window runtime histograms and CPU | Sustained synchronous or callback work | Capture CPU profile during affected route load |
| Loop delay spikes, ELU average moderate | Delay max/p99, CPU scheduling, GC events | Bursty task, throttling, or pause | Shorter windows and profile around spikes |
| Downstream span rises only on new connections | Connection reuse and network phase timing | DNS, TCP, TLS, or remote admission | Compare reused connection and forced-new connection |
| RSS rises, heap stable | Process and V8 memory series | Buffers, native allocation, fragmentation | Allocation profile and native-memory review |
| Heap rises across workload cycles | Heap after comparable GC points | Retained JavaScript objects | Two controlled heap profiles or snapshots |
| Server metrics look normal, edge p95 rises | Edge minus app timing | Proxy queue, network, response streaming | Inspect edge timing and response completion |
No row is a diagnosis by itself. It is a choice of the next test.
Production operating checklist
- Define request start and end boundaries at the edge and application.
- Publish route-level p50, p95, p99, throughput, error, and timeout metrics.
- Time pool acquisition separately from database execution.
- Time downstream attempts and record retry count and timeout phase.
- Track event-loop delay in milliseconds and ELU over matching windows.
- Correlate logs and spans with
AsyncLocalStorage, without high-cardinality metric labels. - Record CPU, heap, RSS, GC duration, and container throttling.
- Preserve slow and failed traces with an understood sampling policy.
- Load test after warm-up with realistic payloads, concurrency, and arrivals.
- Verify generator capacity and coordinated-omission handling.
- Capture profiles only with a safe operational plan.
- Change one suspected bottleneck, then rerun the same measurement.
The operating rule is to attribute elapsed time before optimizing code. A high p95 says there is a tail. Stage clocks say where it formed. Runtime metrics say whether the event loop could run. Profiles and database evidence identify the work. Keep those claims separate, and the incident stops being a contest between plausible guesses.